Visualizing vaccination rates
National Institute for
Public Health and the Environment (RIVM)
Visual communication for RIVM
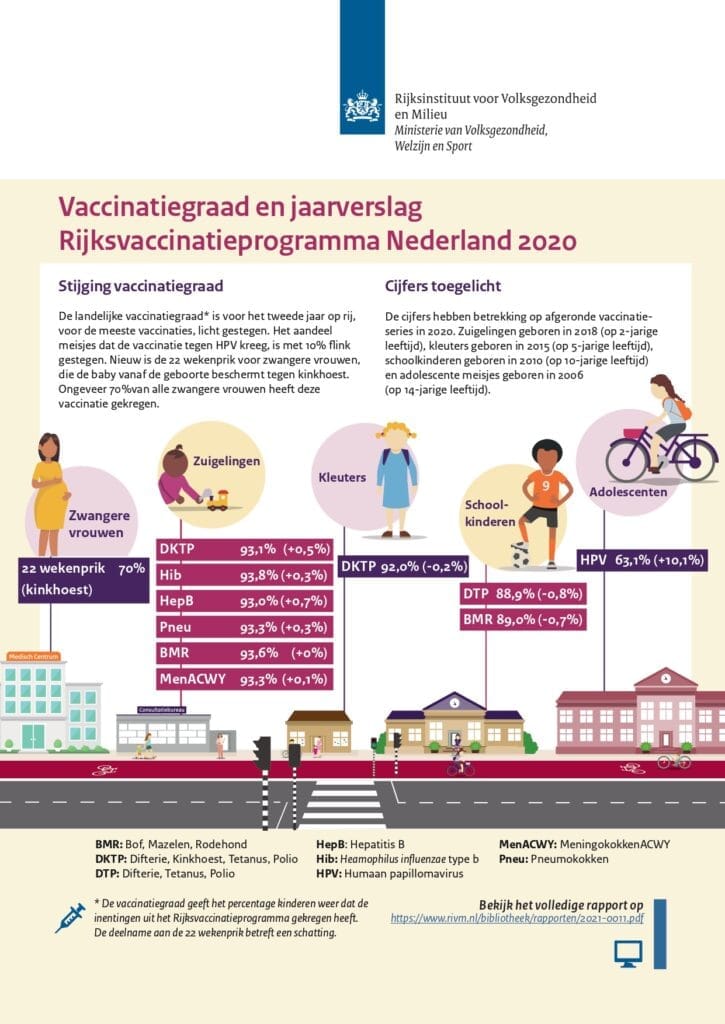
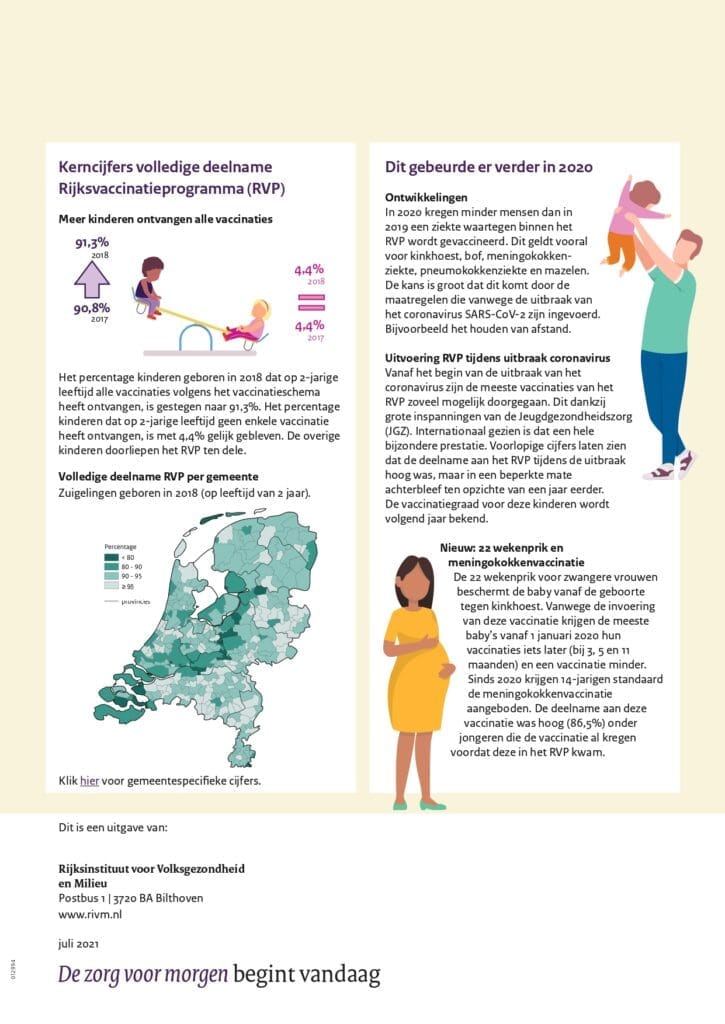
Want to show what you want to convey at a glance? For RIVM, we visualised figures on vaccination coverage, which they publish annually. The goal was to make the data compact, understandable, visually appealing, and digitally accessible. Creating information available to everyone.
The heart of the matter
Visual communication must accurately convey a message and starts with a clear strategy. What is the goal? Who is the target audience? Then comes the core message. After that, you determine the best way to visualize it. For RIVM, the guiding theme was the life course of children and the vaccinations they receive at different stages of their lives. Stages that run parallel to important milestones, such as starting nursery, primary school, and secondary education.
Digital accessibility
People with visual impairments, such as those who are (color)blind or partially sighted, should also be able to easily absorb the information from this visual. That is why color contrast has been carefully considered, images are provided with alternative text, and the read-aloud function has been optimally configured. In the interactive design, we avoid using pop-up screens to ensure better digital accessibility.
All directions
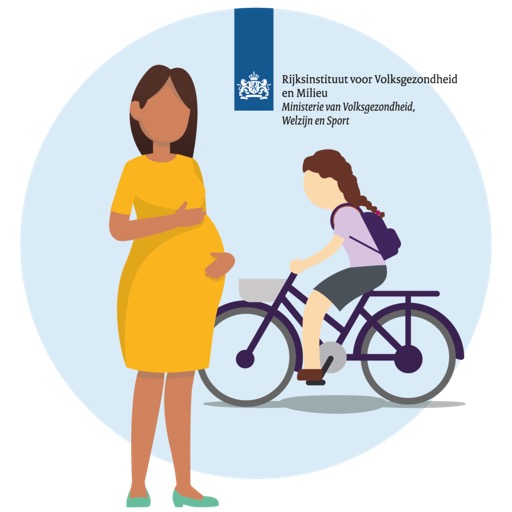
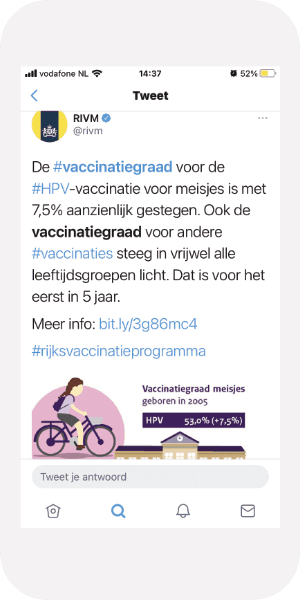
The main visual can be read from left to right, top to bottom, and vice versa. It presents figures for all vaccinations included in the National Immunisation Program, stands independently, and its components can also be used separately, on social media for example. The layout, featuring school buildings and children of various age groups, helps readers easily interpret the data. As a result, the RIVM received significantly fewer questions about vaccination coverage and compliments us for our work!